1. Introduction
‘Omics’ technologies yield large datasets, which are commonly subjected to cluster analysis in order to group them into comprehensible communities, i.e. co-regulated groups, which might be functionally related (Si et al., 2011). A critical step in cluster analysis is cluster validation (Handl et al., 2005), the most stringent form of validation being the assessment of exact reproducibility of a cluster in the light of the uncertainty of the data. This issue is addressed by pyGCluster, an algorithm working in two steps. Firstly it creates many agglomerative hierarchical clusterings (AHCs) of the input data by injecting noise based on the uncertainty of the data and clusters them using different distance linkage combinations (DLCs). Secondly, pyGCluster creates a meta-clustering, i.e. clustering of the resulting, highly reproducible clusters into communities to gain a most complete representation of common patterns in the data. Communities are defined as sets of clusters with a specific pairwise overlap.
1.1. Algorithm Workflow
The workflow of pyGCluster can be divided in:
- iterative steps
- re-sample the data based on mean and standard deviation
- clustering of data using different distance linkage combinations (DLCs)
meta-clustering of highly reproducible clusters into communities, i.e. sets of clusters with a specific overlap
visualize results via node maps, expression maps and expression profiles
1.1.1. Re-sampling & clustering
For each iteration, a new dataset is generated evoking the re-sampling routine. pyGCluster uses by default a noise injection function that generates a new data set by drawing from normal distributions defined by each data point, i.e. object o in condition l is defined by μol± σol. Clustering is then performed using SciPy or fastcluster routines.
1.1.2. Community construction
Communities are created after the iterations by a meta-clustering of the most frequent clusters, i.e. top X% or top Y number of clusters. Community construction is performed iteratively through an AHC approach with a specifically developed distance metric (see publication) and complete linkage. Complete linkage was chosen because it insures that all clusters or meta-clusters have overlapping objects. The customized distance metric ensures that a) smaller clusters are merged earlier in the hierarchy (closer to the bottom) and b) clusters that have a smaller overlap to each other than the threshold will merge after the root, i.e. never into the same branch. After each iteration, very closely related clusters (in terms of their object content) are merged in the hierarchy forming one branch or community starting from the root. The final node map shows these iterations and where meta clusters are merged into the community. The closest node to the root in the final node map is the last iteration, in which no change to the community composition was detected. Using this approach the number of final clusters or communities to consider and analyze is reduced.
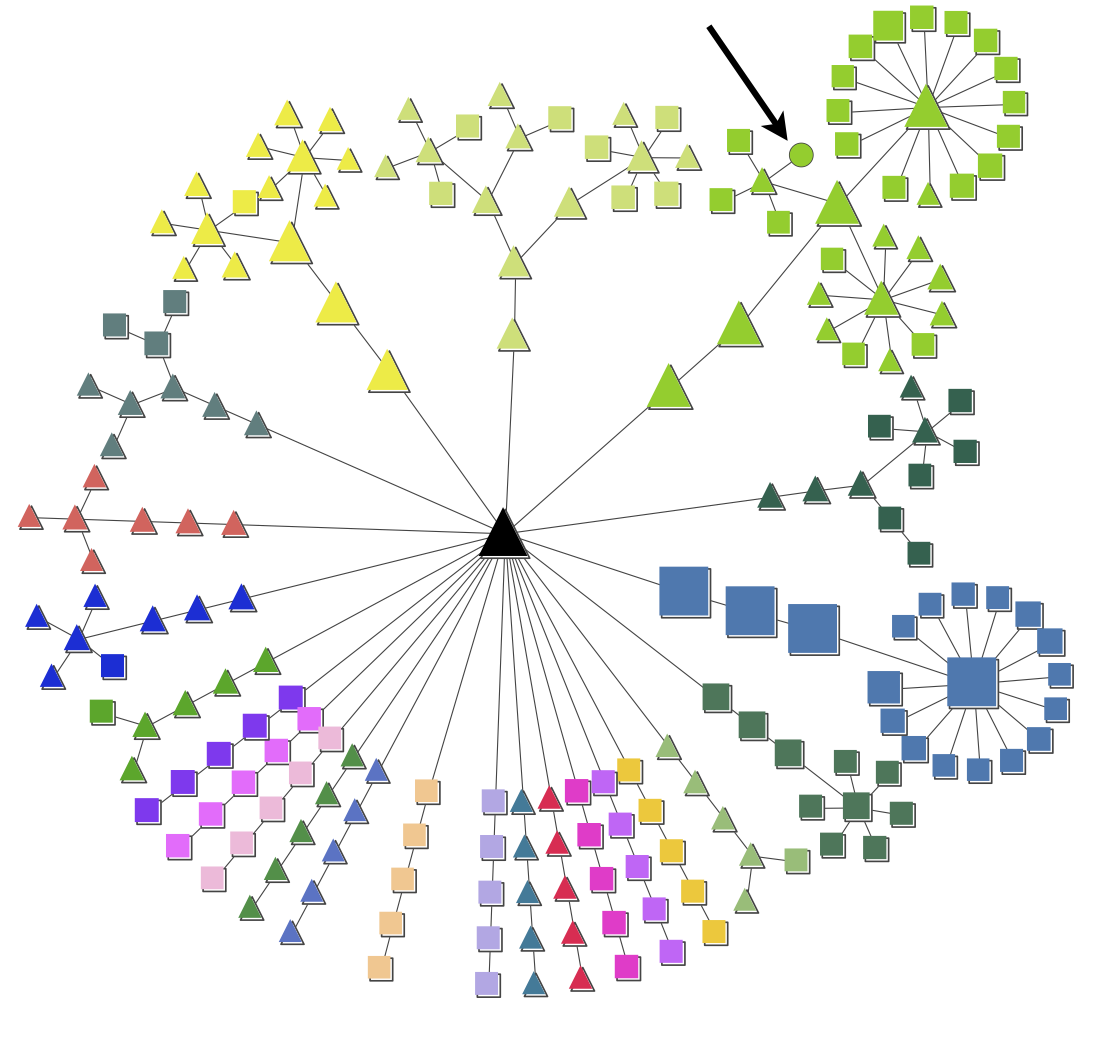
1.1.3. Node map and expression map example
The figures show an example of a node map and expression map generated by pyGCluster. The node map illustrates the data set of Höhner et al. (2013). The node shapes indicate whether a cluster was found using Euclidean distance (squares), correlation distance (circles) or both (triangles). The node color indicates the community membership. The strength of pyGCluster is shown in the green community in which Euclidean and correlation distance identified high frequency clusters (see arrow). Both distance metrics were required to identify all clusters. The black triangle in the middle represents the root node. Since the community construction is performed iteratively, the different iter steps are visible in the node map. For each community, the node closest to the root is the last iteration in which no change in the communities with respect to their composition was detected.
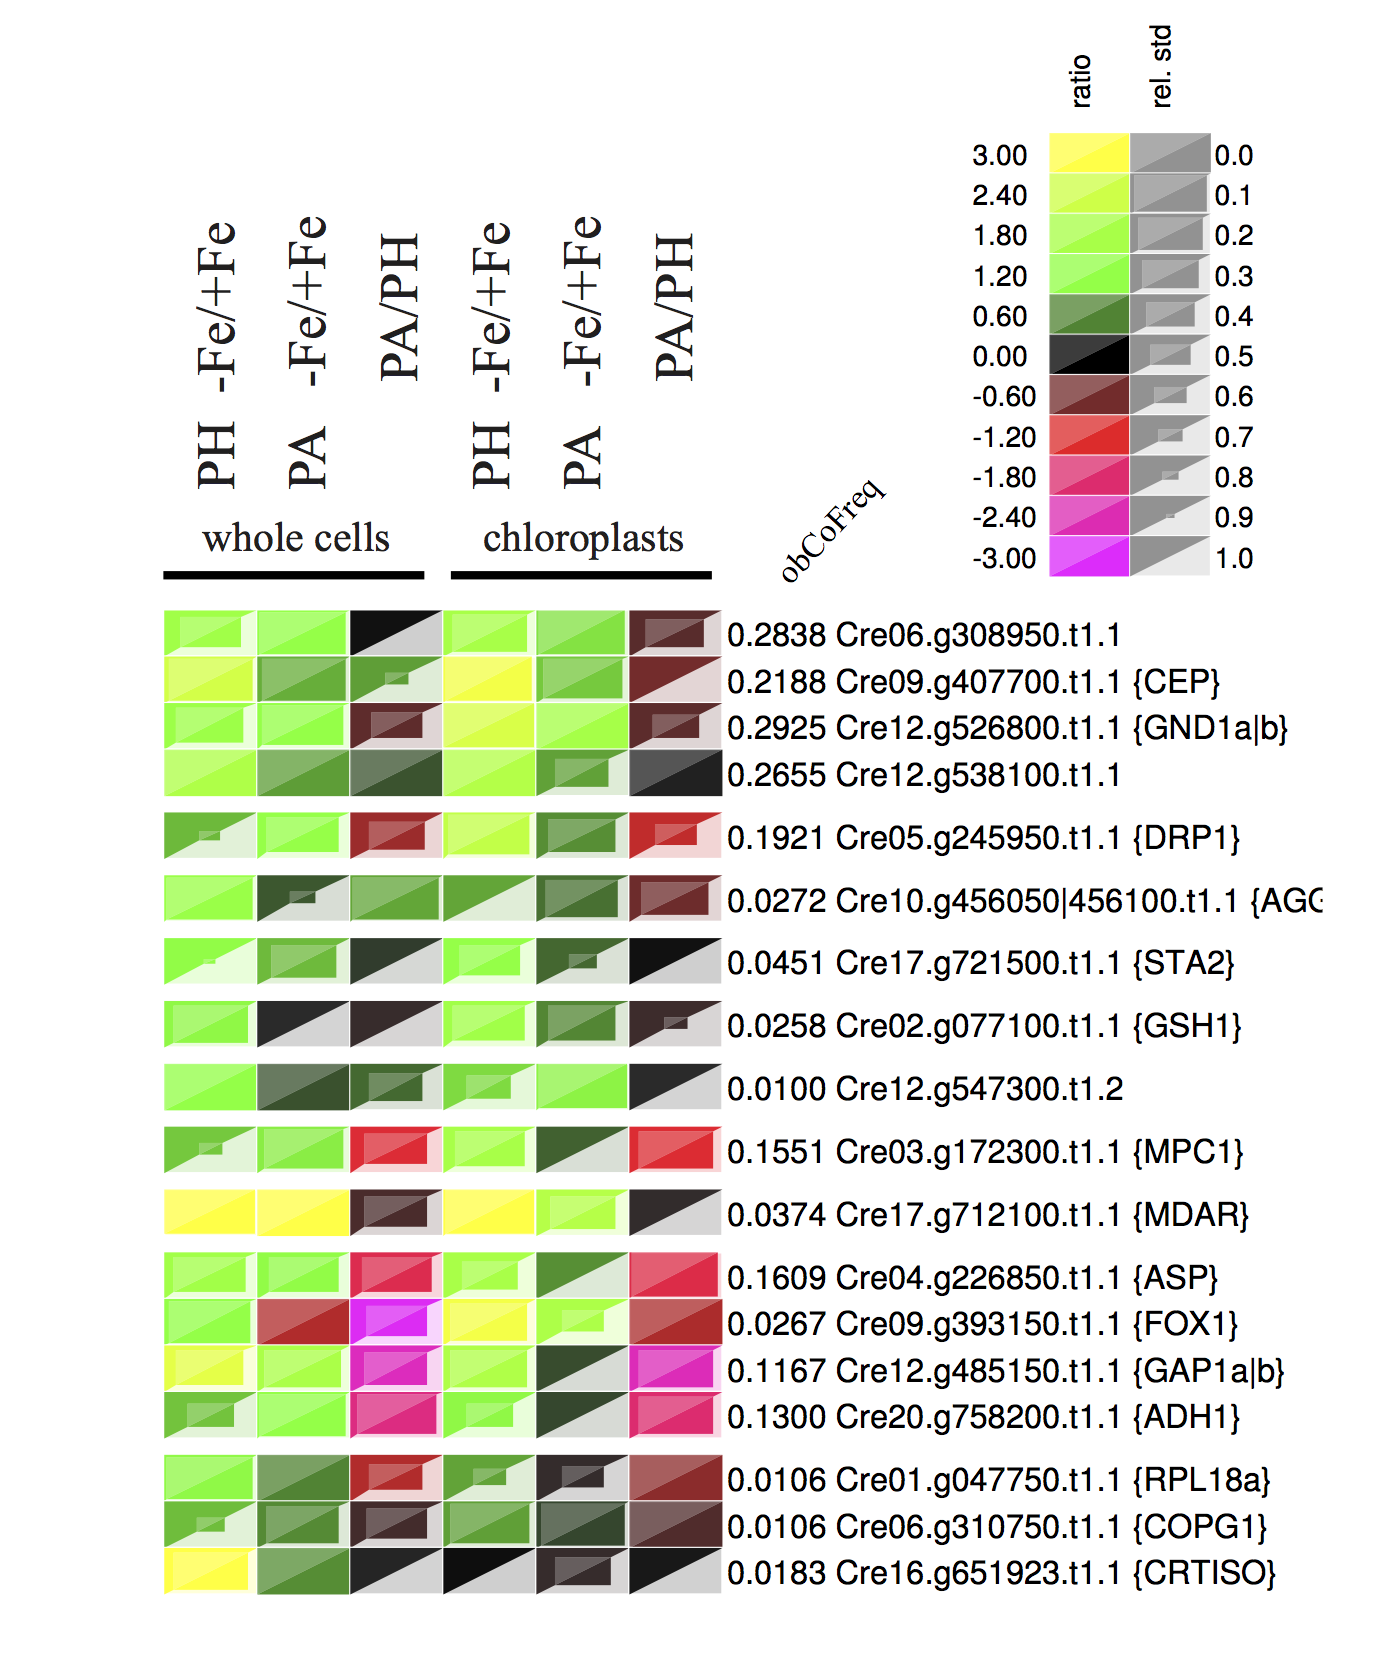
The example expression map is taken from Höhner et al. (2013)
Note
Some texts where copied from the original publication and are thus hereby marked as citation
1.2. General information
Copyright 2011-2013 by:
D. Jaeger,J. Barth,A. Niehues,C. Fufezan
The latest Documentation was generated on: November 04, 2013
1.2.1. Contact information
Please refer to:
Dr. Christian FufezanInstitute of Plant Biology and BiotechnologySchlossplatz 8 , R 110.105University of MuensterGermanyeMail: christian@fufezan.netTel: +049 251 83 24861
1.3. Implementation
pyGCluster requires Python2.7 or higher, is freely available at http://pyGCluster.github.io and published under MIT license.
- pyGCluster dependencies are:
- numpyscipyfastcluster (optionally)rpy2 (optionally)graphviz (optionally)
Fastcluster (Müllner,D. (2013)) offers significant speed increase compared to the same SciPy routines.
1.4. Download
- Get the latest version via github
- or the latest package at
- The complete Documentation can be found as pdf
1.5. Citation
Please cite us when using pyGlcuster in your work.
Jaeger, D., Barth, B., Niehues, A. and Fufezan, C. (2013) pyGCluster, a novel hierarchical clustering approach
- The original publication can be found here:
1.6. Installation
Please execute the following command in the pyGCluster folder:
sudo python setup.py install
1.6.1. Installation notes
If Windows XP (SP3) is used please make sure to install SciPy version 0.10.0
1.6.2. Functionality check
After installation, please run the script test_pyGCluster.py from the exampleScripts folder to check if pyGCluster was installed properly.
Testscript to demonstrate functionality of pyGCluster
A synthetic dataset is used to check the correct installation of pyGCluster. This dataset cotains 10 ratios (Gene 0-9) which were randonmly sampled between 39.5 and 40.5 in 0.1 steps with a low standard deviation (randonmly sampled between 0.1 and 1) and 90 ratios (Gene 10-99) which were randonmly sampled between 3 and 7 in 0.1 steps with a high standard deviation (randonmly sampled between 0.1 and 5)
5000 iterations are performed and the presence of the most frequent cluster is checked.
This cluster should contain the Genes 0 to 9.
Usage:
./test_pyGCluster.py
When the iteration has finished (this should normally take not longer than 20 seconds), the script asks if you want to stop the iteration process or continue:
iter_max reached. See convergence plot. Stopping re-sampling if not defined
otherwise ...
... plot of convergence finished.
See plot in "../exampleFiles/functionalityCheck/convergence_plot.pdf".

Enter how many iterations you would like to continue.
(Has to be a multiple of iterstep = 5000)
(enter "0" to stop resampling.)
(enter "-1" to resample until iter_max (= 5000) is reached.)
Enter a number ...
Please enter 0 and hit enter (The script will stop and the test will finish).
The results are saved into the folder functionalityCheck.
Additionally expression maps and expression profiles are plotted.
1.7. References
Bréhélin,L. et al. (2008) Using repeated measurements to validate hierarchical gene clusters. Bioinformatics, 24, 682-628.Gansner,E.R. and North,S.C. (2000) An open graph visualization system and its applications to software engineering. Software Pract. Exper., 30, 1203-1233.Handl,J. et al. (2005) Computational cluster validation in post-genomic data analysis. Bioinformatics, 21, 3201-3212.Höhner,R. et al. (2013) The metabolic status drives acclimation of iron deficiency responses in Chlamydomonas reinhardtii as revealed by proteomics based hierar-chical clustering and reverse genetics. Mol. Cell. Proteomics, in press.Müllner,D. (2013) fastcluster: fast hierarchical agglomerative clustering routines for R and Python. J. Stat. Softw., 53, 1-18.Saeed,A.I. et al. (2003) TM4: A free, open-source system for microarray data man-agement and analysis. Biotechniques, 34, 374-378.Shannon,P. et al. (2003) Cytoscape: a software environment for integrated models of biomolecular interaction networks. Genome Res., 13, 2498-2504.Si,J. et al. (2011) Model-based clustering for rna-seq data. Joint statistical meeting, Juli 30 - August 4, Florida.